Categories
Antarctica CO2 Newsletter CO2 Newsletter Barbat articles CO2 Newsletter commentary Science Scientists

“remarkably accurate statements” – Professor van den Broeke assesses “CO2 Newsletter” article on glacial melt

Michiel van den Broeke, Professor of Polar Meteorology at Utrecht University (longer bio at end of post) very kindly agreed to read William Barbat’s article “Glacier melt: How soon? How fast?” and explain what Barbat got right (and wrong) and where the science has gone in the almost 50 years since then. It’s a brilliant (imo) piece, and I hope you learn as much as I did. Please do share it, comment on it.

Professor van den Broeke

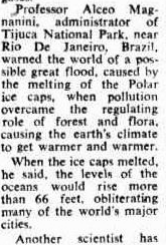
In the March 1980 edition of the CO2 NEWSLETTER, William Barbat reported about the threat of melting ice sheets and the rapid, multi-metre sea level rise that could ensue. Undoubtedly, Barbat had been triggered by the 1978 scientific publication of British glaciologist John Mercer (1922-1987), then employed at (what would later become) the Byrd Polar Research Centre of Ohio State University (Mercer, 1978). In his Nature article: West Antarctic ice sheet and CO2greenhouse effect: a threat of disaster, Mercer pointed out that the increase in CO2 concentration in the Earth’s atmosphere caused by the burning of fossil fuels would result in strong Antarctic warming, potentially leading to the disintegration of the large Ross and Filchner-Ronne ice shelves. In the absence of their buttressing effect, the West Antarctic ice sheet would collapse, raising global sea levels by several metres.

Today’s cryospheric research relies heavily on three complementary techniques: in situ observations, satellite observations and numerical models. In situ observations are often scattered in space, but to their credit have relatively long time series (typically decades in the Polar Regions), indispensable for trend detection. They moreover provide ground truth for satellites and serve to evaluate/calibrate climate and ice sheet models. Satellites, on the other hand, with their limited mission lifetime of typically 5-10 years, produce short time series, but they have the advantage of near-complete spatial coverage, filling in the spatial gaps left by the in situ observations. Numerical models, once evaluated and/or calibrated with the in situ and remotely sensed observations, can help us isolating the physical processes at work and, when they perform satisfactorily, make credible future projections.

When Mercer published his study almost 50 years ago, he had to make do with very limited observations and crude models. Although the density of in situ observations in the polar regions increased sharply after the 1957/58 International Geophysical Year (IGY, also referred to as the Third International Polar Year), observations remained very scarce notably in the ice sheet interiors. While some satellites for earth observation, notably Landsat, were available at that time, time series were less than a decade long. For Earth’s cryosphere, the satellite era started in earnest more than a decade later, with the launch of European Space Agency‘s radar-equipped ERS-1 in 1991. Finally, in the late 1970’s, climate and ice sheet models were still in their infancy; the model projections of future Antarctic warming used in Mercer’s study were from Syukuro Manabe, who in 2021 was co-awarded the Nobel prize in Physics for his pioneering contributions to climate modelling.

In spite of this, both Mercer’s 1978 Nature paper and William Barbat’s 1980 report in the CO2NEWSLETTER highlight the remarkable body of knowledge on the world’s ice sheets that had been gathered. Their reported total volume expressed in sea level rise equivalent of 66 m only deviates by 1% from today’s numbers1. Estimates of sea level stands of 6 m above present during the last interglacial (~125.000 years ago) fall well within the range of current estimates (6 to 9 m) (Dutton et al., 2015). Other remarkably accurate statements concern the approximately 50/50 partitioning of meltwater runoff and iceberg calving as sink terms in the mass balance of the Greenland ice sheet and the importance of ice shelf buttressing for grounded ice flow in Antarctica, which decades later was observationally confirmed after the sudden disintegration of Larsen B ice shelf in 2002 (Scambos et al., 2004). Mercer also correctly identified the apparent temperature threshold for the viability of Antarctic ice shelves, later corroborated by the demise of Antarctic Peninsula ice shelves after several decades of strong warming (Morris & Vaughan, 2013; Scambos et al., 2004). Also recently been confirmed is Mercer’s statement that a 5 K atmospheric warming could destabilize parts of the large Ross and Filchner-Ronne ice shelves (Van Wessem et al., 2023).

Inevitably, these early reports also have flaws and large uncertainties, which the authors frankly admit. Lacking direct observations, and realising that around 1980 mass changes of both ice sheets were significantly smaller than they are today (IMBIE, 2018, 2020), not much could be said about the magnitude of mass loss of the ice sheets, let alone the processes that caused them. It would take the launch in 2002 of the satellite pair of the Gravity Anomaly and Climate Experiment (GRACE) before mass loss from both ice sheets was convincingly demonstrated (Velicogna & Wahr, 2005; Velicogna, 2006). GRACE also showed that the recent mass loss in Antarctica is concentrated in the Amundsen and Bellingshausen Seas sectors, and is associated with ice shelf thinning owing to increased ocean melting at their base, rather than weakened buttressing of the Ross and Filchner-Ronne ice shelves. Making projections based on scanty information proved even harder. Mercer’s assumption that CO2 concentration in the atmosphere would double in 50 years was too pessimistic: atmospheric CO2 levels increased by 26%, from 337 to 426 parts per million, between 1979 and 2025. As a result, Antarctic warming remains far from the values reported in his paper.

This begs the question: if we were in Mercer’s shoes today, would we do much better in projecting the future of the Earth’s big ice sheets? Based on the latest IPCC report (IPCC, 2021), my take is that the uncertainties are still surprisingly large and not so dissimilar to what they were in 1978. Since then, our knowledge and technical (observational, modelling) capabilities have of course expanded tremendously, but we have also identified numerous new unknowns. The net result is that future ice sheet mass change and associated sea level rise remain highly uncertain, and that we still may be in for unpleasant surprises from nonlinear processes leading to tipping points that are currently not or poorly understood. Given the complex interactions between atmosphere, ocean and ice sheets that straddle several orders of magnitude in temporal and spatial scales, it is clear that this deep uncertainty will not be resolved anytime soon. It thus seems fitting to conclude with the statement made by Mercer in his 1978 paper, which still firmly stands: “…despite the crudities and inadequacies of present techniques for modelling the climatic effects of increasing atmospheric CO2content and the resultant doubts […], we cannot afford to let the atmosphere carry out the experiment before taking action because if the results confirm the prognosis, and we should know one way or the other by the end of the century, it will be too late to remedy the situation…”.

Bibliography

Dutton, A., Carlson, A. E., Long, A. J., Milne, G. A., Clark, P. U., DeConto, R., Horton, B. P., Rahmstorf, S., & Raymo, M. E. (2015). SEA-LEVEL RISE. Sea-level rise due to polar ice-sheet mass loss during past warm periods. Science, 349(6244), aaa4019. https://doi.org/10.1126/science.aaa4019

IMBIE. (2018). Mass balance of the Antarctic Ice Sheet from 1992 to 2017. Nature, 558(7709), 219-222. https://doi.org/10.1038/s41586-018-0179-y

IMBIE. (2020). Mass balance of the Greenland Ice Sheet from 1992 to 2018. Nature, 579(7798), 233-239. https://doi.org/10.1038/s41586-019-1855-2

IPCC. (2021). Climate Change 2021: The Physical Science Basis. Contribution of Working Group I to the Sixth Assessment Report of the Intergovernmental Panel on Climate Change. Masson-Delmotte, V., P. Zhai, A. Pirani, S.L. Connors, C. Péan, S. Berger, N. Caud, Y. Chen, L. Goldfarb, M.I. Gomis, M. Huang, K. Leitzell, E. Lonnoy, J.B.R. Matthews, T.K. Maycock, T. Waterfield, O. Yelekçi, R. Yu, and B. Zhou (eds.), Cambridge University Press, Cambridge, United Kingdom and New York, NY, USA. https://doi.org/10.1017/9781009157896.

Mercer, J. H. (1978). West Antarctic ice sheet and CO2 greenhouse effect: a threat of disaster. Nature, 271(5643), 321–325. https://doi.org/https://doi.org/10.1038/271321a0

Morris, E. M., & Vaughan, D. G. (2013). Spatial and Temporal Variation of Surface Temperature on the Antarctic Peninsula And The Limit of Viability of Ice Shelves. In Antarctic Peninsula Climate Variability: Historical and Paleoenvironmental Perspectives (pp. 61-68). https://doi.org/10.1029/AR079p0061

Scambos, T. A., Bohlander, J. A., Shuman, C. A., & Skvarca, P. (2004). Glacier acceleration and thinning after ice shelf collapse in the Larsen B embayment, Antarctica. Geophysical Research Letters, 31(18). https://doi.org/10.1029/2004gl020670

Van Wessem, J. M., Van den Broeke, M. R., Wouters, B., & Lhermitte, S. (2023). Variable temperature thresholds of melt pond formation on Antarctic ice shelves. Nature Climate Change. https://doi.org/10.1038/s41558-022-01577-1

Velicogna, I., & Wahr, J. (2005). Greenland mass balance from GRACE. Geophysical Research Letters, 32(18). https://doi.org/10.1029/2005gl023955

Velicogna, I. a. J. W. (2006). Measurements of Time-Variable Gravity Show Mass Loss in Antarctica. Science, 311(5768), 1754-1756. https://doi.org/DOI: 10.1126/science.1123785

Footnotes

1 Combining radar flight lines of ice thickness with mass conservation provide us with accurate estimates of the sea level equivalent volumes of the ice sheets of Greenland (7.4 m) and Antarctica (57.8 m), (Morlighem et al., 2017; Morlighem et al., 2019).

Michiel van den Broeke (Rotterdam, 1968) has been Professor of Polar Meteorology at Utrecht University since 2008, where he studies the interaction between the climate and the large ice sheets of Antarctica and Greenland. Between 2016 and 2022, Michiel served as Scientific Director of the Institute for Marine and Atmospheric Research Utrecht (IMAU), where around 90 people work on developing a fundamental understanding of all components of the climate system.

Categories
Antarctica Interviews

Interview with Mauri Pelto, glaciologist

Bluesky is becoming a home away from the HellSite for scientists. I recently “met” Mauri Pelto, whose bio describes himself thus –

Glaciologist who has spent 40+ years doing fieldwork on glaciers. Science advisor to NASA Earth. US Representative to the World Glacier Monitoring Service. Author of blog “From a Glaciers Perspective”. Grandparent, avid skier, dog walk/runner.

His googlescholar profile is here.

He kindly agreed to an email interview, and here it is.

  1. A little bit about you – who you are, where you were educated, “why glaciology”? I began working on glaciers in Alaska during the summer of 1981. The initial goal as to cross country ski in the summer to help me qualify for the US Ski Team. This worked, but I chose grad school instead in 1984 enrolling at the University of Maine. I designed the North Cascade Glacier Climate Project as a 50 year field project to monitor glaciers across the range. This was in response to a high priority of the National Academy of Sciences in 1983. At the time the USGS monitored a single glacier in several different ranges, and with the Reagan budget cuts was not going to be able to expand. The glaciers are all in Wilderness areas precluding the use of mechanized equipment and requiring backpacking to access. I chose not to seek federal funding and have financed the project with consulting work.

2. How and when you first heard about the issue of carbon dioxide build-up (presumably in your undergraduate degree?)

Terry Hughes was my advisor, he was very knowledgeable about ice sheets, while all my experience and insights were on alpine glaciers. I had a chance to work on Pine Island and Thwaites Glacier projects in 1985 and Jakobshavn Glacier in 1986. We , the glaciologic community understood these locations were key places where profound change was going to happen and set up projects to begin monitoring.

 In ice cave under Sholes Glacier

3. John Mercer wrote a famous (well, it’s all relative) paper for Nature, in January 1978 – do you recall reading it? Had you met him by then? Any recollections? I met John Mercer before meeting Terry Hughes. He had worked in Patagonia and Alaska areas I was more experienced with. I sought his guidance along with William O. Field about where to set up a project. He was not overly helpful.

4. Terry Hughes wrote a paper in 1980 about the “soft underbelly of the West AIS” – again, how did you know Terry, any recollections? I worked with Terry for four-years the first year working most of the time in his office with him. I finished my Masters and then PhD as quickly as possible in 1989. He was a brilliant, iconoclastic person.

On Mount Baker with my daughter Jill who co-directs the project with me now

5. How, from your perspective, has glaciology changed as a discipline over the years you’ve been involved (e.g. fleshing out the bsky comment)

I had a chance to address the glaciology community at the 100th anniversary AGU meeting in Washington DC in 2019. I pointed out that thirty five years prior all the glaciologists in the world could have fit in this room, that now held only as many people ~300 as worked on just the Helheim Glacier for example. This rapid increase in number of glaciologists was due unfortunately to the dire necessity that climate change posed for the cryosphere. That we need everyone of you to focus on what you do well and monitor, observe, develop and model that. That this generation of scientists was embracing collaboration instead of competition. This is why I have for 20 years incorporated artists in our research expeditions. Note below. I continue to work in the field every summer and with NASA on projects like the one published today.

https://earthobservatory.nasa.gov/images/154764/alaskas-brand-new-island https://www.cbsnews.com/video/capturing-the-melting-of-glaciers-with-data-and-art/

    Categories
    Antarctica

    September 1, 1980 – “Soft Underbelly of the West Antarctic Ice Sheet” article submitted

    Forty five years ago, on this day, September 1st, 1980, Terry Hughes, glaciologist, submits The weak underbelly of the West Antarctic ice sheet” to Journal of Glaciology,

    The amount of carbon dioxide in the air was 338ppm. As of 2025, when this post was published, it is 430ppm. This matters because the more carbon dioxide in the air, the more heat gets trapped. The more heat, the more extreme weather events. You can make it more complicated than that if you want, but really, it’s not. Fwiw, I have a tattoo of the Keeling Curve on my left forearm.

    The weak underbelly of the West Antarctic ice sheet | Journal of Glaciology | Cambridge Core

    The broader context was that the melting of ice caps was one of the “indicators” for awareness of climate change. 

    The specific context was John Mercer’s article had come out in Nature in January 1978 .

    What I think we can learn from this is that we had plenty of advanced warning.

    What happened next – the emissions kept climbing. They were always going to climb a bit, but they are now 60% higher than they were in 1990, when we all agreed that Something Must Be Done.

    See also the novel Icequake

    What do you think? Does this pass the ‘so what?’ threshold? Have I got facts wrong? Interpretation wrong? Please do comment on this post, unless you are a denialist, obvs.

    References

    Hughes TJ. The weak underbelly of the West Antarctic ice sheet. Journal of Glaciology. 1981;27(97):518-525. doi:10.3189/S002214300001159X

    Also on this day: 

    September 1, 1970 – Environmentalism is an elite-diversion tactic, says American Maoist

    September 1, 1972 – “Man-Made Carbon Dioxide and the “Greenhouse Effect” published in Nature

    September 1, 1983- #climate change is all in the game, you feel me?

    September 1, 1998 – Sydney Futures Exchange foresees a bright future. Ooops.

    Categories
    Antarctica

    March 18, 2022 – Antarctic has a day 38.5 degrees above seasonal average.

    Three years ago, on this day, March 18th, 2022,

    On 18 March, 2022, scientists at the Concordia research station on the east Antarctic plateau documented a remarkable event. They recorded the largest jump in temperature ever measured at a meteorological centre on Earth. According to their instruments, the region that day experienced a rise of 38.5C above its seasonal average: a world record. https://www.theguardian.com/environment/2024/apr/06/simply-mind-boggling-world-record-temperature-jump-in-antarctic-raises-fears-of-catastrophe

    The amount of carbon dioxide in the air was roughly 418ppm. As of 2025 it is 427ppm, but check here for daily measures. 

    The context was that we’re starting to see, we have been seeing for 20 or 30 years, not just weather events that people thought wouldn’t happen, but that couldn’t happen. In some cases, perhaps many cases, that’s based on our overconfidence in our models and our intellects and our inability to see ramifications at a distance without going or mystic woo- woo New Age.

    What I think we can learn from this is that we don’t know nearly as much as we think we do about these absurdly complex and I mean complex. Not complicated. I mean complex systems and systems of systems. 

    But against that backdrop, we do know that if you pour billions and billions of tons of carbon dioxide, accumulating into more than 2 trillion of tons into the atmosphere,in a geological eye blink, there are going to be some interesting consequences. 

    What happened next Antarctica continues to warm. The planet continues to warm. We seem to be off the leash. 

    coNTExt – John Mercer article in Nature 1978

    What do you think? Does this pass the ‘so what?’ threshold? Have I got facts wrong? Interpretation wrong? Please do comment on this post, unless you are a denialist, obvs.

    Also on this day: 

    March 18, 1958 – Military man spots carbon dioxide problem

    March 18, 1968 – Bobby Kennedy vs Gross National Product

     March 18, 1971 – “Weather modification took a macro-pathological turn”

    March 18, 2010 – “Solar” by Ian McEwan released.

    Categories
    Antarctica

    December 26, 2019 – Antarctic journeys…

    Five years ago, on this day, December 26th, 2019, 

    On December 26, 2019, Erin Pettit trudged across a plain of glaring snow and ice, dragging an ice-penetrating radar unit the size of a large suitcase on a red plastic sled behind her. The brittle snow crunched like cornflakes underneath her boots—evidence that it had recently melted and refrozen following a series of warm summer days. Pettit was surveying a part of Antarctica where, until several days before, no other human had ever stepped. A row of red and green nylon flags, flapping in the wind on bamboo poles, extended into the distance, marking a safe route free of hidden, deadly crevasses. The Thwaites Ice Shelf appeared healthy on the surface. But if that were the case, Pettit wouldn’t have been there. https://www.scientificamerican.com/article/antarcticas-collapse-could-begin-even-sooner-than-anticipated/

    The amount of carbon dioxide in the air was roughly 412ppm. As of 2024 it is 425ppm, but check here for daily measures. 

    The context was

    We are forever doing impact science, while the production science kills us all. So it goes.

    What I think we can learn from this

    Brave people have gathered the data.  Lazy and scared people (including myself) don’t make the data matter.

    What happened next

    The emissions kept climbing, obvs.

    Also on this day:

    December 26, 1968 – “Global Effects of Environmental Pollution” symposium

    December 26, 1997 – #climate denial machine exposed again and again

    Categories
    Antarctica

    November 27, 1969 – Canberra Times runs pollution article, mentions melting ice-caps

    Fifty four years ago, on this day, November 27, 1969, the Canberra Times ran a piece about pollution….

    Paul Backshall of London Reuters with Pollution: Gases in the Atmosphere article, reprinted in Canberra Times Thursday 27 November 1969, page 18 Check out Trove here.

    The amount of carbon dioxide in the air was roughly 324.6ppm. As of 2023 it is 419ppm, but check here for daily measures. 

    The context was that everyone was writing articles about air pollution at this point. Someone in Reuters in London had written something of that ilk, and the Canberra Times had syndicated it. 

    What I think we can learn from this is that newspapers are hungry beasts and will syndicate things, even if it doesn’t have much of local spin to it, especially if the issue is popular enough.

    What happened next

    The Canberra Times kept reporting. Everybody was aware of what was at stake. What didn’t happen was that we didn’t stop the party. And now, the hangover…

    What do you think? Does this pass the ‘so what?’ threshold? Have I got facts wrong? Interpretation wrong? Please do comment on this post, unless you are a denialist, obvs.

    Categories
    Antarctica

    November 20, 1973 – “Is the West Antarctic Ice Sheet Disintegrating?”

    Fifty years ago, on this day, November 20, 1973, a researcher asked the question in the blog title.

    1973 Is the west Antarctic ice sheet disintegrating? T Hughes, Journal of Geophysical Research. https://agupubs.onlinelibrary.wiley.com/doi/abs/10.1029/JC078i033p07884

    While there is no explicit mention of climate, it shows the ideas was around, and perhaps put the idea in Mercer’s head?

    The amount of carbon dioxide in the air was roughly 329.7ppm. As of 2023 it is 419ppm, but check here for daily measures. 

    The context was people had been looking at sea level rise for a while. They knew that the ice-caps were melting (different causes were being thrown around). The above article does not mentioned carbon dioxide buildup. It is just part of the general pattern of well, “the world’s getting warmer” and there are consequences for that…

    What I think we can learn from this/what we should know. 

    The crucial thing is that while the East Antarctic Ice Sheet is sitting on bedrock, the West Antarctic Ice Sheet is basically a lot of ice perched on mountain tops. So much less stable because warmer water can get underneath and loosen it. 

    What happened next

    In 1978 John Mercer’s paper “West Antarctic ice sheet and C02 greenhouse effect: a threat of disaster” was published in Nature. It didn’t cite the Hughes 1973 paper, but it DID cite the following – 

    Hughes, T. 1975. The West Antarctic Ice Sheet: Instability, disintegration, and initiation of Ice Ages. Reviews of Geophysics, Volume13, Issue 4, Pages 502-526 https://doi.org/10.1029/RG013i004p00502

    Btw, the answer to Hughes’ 1973 question has become an emphatic “hell yes.”

    What do you think? Does this pass the ‘so what?’ threshold? Have I got facts wrong? Interpretation wrong? Please do comment on this post, unless you are a denialist, obvs.

    Categories
    Antarctica Arctic

    October 8, 1978 – The Times runs an “ice caps melting” story

    Forty five years ago, on this day, October 8, 1978, the Times ran an article, on page 15, about the ice caps melting, based on a Nature article.

    The amount of carbon dioxide in the air was roughly 335.4ppm. As of 2023 it is 423ppm, but check here for daily measures. 

    The context was that US scientists had produced lots of data and reports that really pointed to a warming world because of carbon dioxide. The World Meteorological Organisation and UNEP were doing the same. The First World Climate Conference was coming up in a few months …

    What I think we can learn from this – the Times used to be a real newspaper.

    What happened next

    We did not act on climate change. And the Antarctic did indeed start to properly melt, as had been hypothesized in 1973. And the West Antarctic ice sheet is exquisitely vulnerable because it is sitting on mountain peaks rather than bedrock.

    What do you think? Does this pass the ‘so what?’ threshold? Have I got facts wrong? Interpretation wrong? Please do comment on this post, unless you are a denialist, obvs.

    Categories
    Antarctica

    January 31, 2002 – Antarctic ice shelf “Larsen B” begins to break up.

    Twenty one years ago, on this day, January 31, 2002, things began to fall apart.

    31 January 2002–7 March 2002- the Larsen B sector collapsed and broke up, 3,250 km² of ice 220 m thick, covering an area comparable to the US state of Rhode Island, disintegrated and collapsed in one season.[6] Larsen B was stable for up to 12,000 years, essentially the entire Holocene period since the last glacial period, according to Queen’s University researchers

    http://en.wikipedia.org/wiki/Larsen_Ice_Shelf

    The amount of carbon dioxide in the air was roughly 371ppm. As of 2023 it is 419.

    The context was folks had been talking about the impacts of greenhouse gas build-up on the Antarctic for a looooong time (try January 25, 1978)

    What I think we can learn from this

    Humans ignore warnings, especially if paying attention would be inconvenient to powerful people who have the ability to ‘help’ everyone else ignore those warnings.  Profound observation, I know – it’s what you have spent all month enjoying, no?

    What happened next

    It helped the film-makers who gave us “The Day After Tomorrow”(2004)  with their opening scene 

    In 2005 British Sea Power’s album Open Season included a song called “Oh Larsen B”

    https://www.youtube.com/watch?v=_HN0rqVJT4U

    You had twelve thousand years and now it’s all over

    Five hundred billion tonnes of the purest pack ice and snow

    Oh Larsen B , oh won’t you fall on me?

    Oh Larsen B , desalinate the barren sea

    Oh I think it’s the start of the end

    Like saw blades through the air

    Your winter overture

    What do you think? Does this pass the ‘so what?’ threshold? Have I got facts wrong? Interpretation wrong?  Do comment on this post.

    Categories
    Antarctica

    Jan 26, 1978: “West Antarctic ice sheet and C02 greenhouse effect: a threat of disaster” article in Nature…

    On January 26 1978, a paper was published in the journal Nature, about the collapse of the West Antarctic Ice Sheet due to rising carbon dioxide emissions. This paper, pithily titled “West Antarctic ice sheet and C02 greenhouse effect: a threat of disaster” was written by John Mercer. You can read more about Mercer (who was a bit of a character) and the fact that he’d been researching and thinking about this since (deep breath) 1968, here…

    In the 1978 paper Mercer pointed out 

    “A disquieting thought is that if the present highly simplified climatic models are even approximately correct, this deglaciation may be part of the price that must be paid in order to buy enough time for industrial civilisation to make the changeover from fossil fuels to other sources of energy”

    Why this matters. The sea level rise, among other things. We’re toast.

    What happened next? Well, we’re not there yet. But we will be soon (a while in human lifespan terms, an eyeblink geologically speaking…) And the East Antarctic Ice Sheet? Not looking too clever either…